
Often we can’t see what’s really happening until we look back and see what’s happened. Month to month stats are what sell headlines, let’s take a look at trends instead to get a true picture of where the market is at.
Here is a recap of the market activity since March 2021:
Sales activity in March hit an all time high across *Metro Vancouver.
With sales totaling 5,843 we surpassed the record set in March 2016, which, back then, sales reported were 56% above the 10 year average.
This past March sales were 72.2 per cent above the 10-year March sales average and is the highest monthly sales total ever recorded in the region.
The MLS® Home Price Index composite benchmark price for all residential properties in Metro Vancouver in March was $1,123,300. This represents a 9.4 per cent increase over March 2020 and a 3.6 per cent increase compared to February 2021.
Download the full report.
April saw another all-time high for sales in Greater Vancouver, but down 14% from March marking the first month over month decline in nearly a year.
True to the spring market we also saw a major increase in inventory. April brought 8,124 new listings to the market in Greater Vancouver, plus another 5,019 in the Fraser Valley - both the highest number of listings to come to the market in April history.
This influx of new listings eased some of the pressure off the market, however, the sales to listings ratio was still at 62% which is a very strong Seller’s Market.
The MLS® Home Price Index composite benchmark price for all residential properties in Metro Vancouver in April was $1,152,600. This represents a 12 per cent increase over April 2020 and a 2.6 per cent increase compared to March 2021.
Download the full report.
May was the second consecutive month with sales declining from the previous month, although with 4,346 sales in Greater Vancouver and 2,951 in the Fraser Valley we could hardly call this a slow month.
The change in the Stress Test (the qualifying rate increased from 4.79% to 5.25%) was announced mid month that it would come into effect June 1, 2021. This may have spurred on some sales activity as Buyers rushed to secure a property while they still qualified at the lower rate.
At the last minute Lenders announced that Buyers could lock in at the lower rate for 90 days.
The MLS® Home Price Index composite benchmark price for all residential properties in Metro Vancouver in May was $1,172,800. This represents a 14 per cent increase over May 2020 and a 1.5 per cent increase compared to April 2021.
Download the full report.
June brought another drop in sales. 3,842 transactions - down 11.4% from May - the lowest level since January 2021.
June was also the lowest month over month increase in prices in at least a year.
We attribute the slowing of activity to the easing of Covid restrictions and the beginning of summer. Buyers, Sellers, and Realtors alike were all enjoying the freedom to travel and visit friends and family.
The MLS® Home Price Index composite benchmark price for all residential properties in Metro Vancouver in June was $1,175,100. This represents a 14.5 per cent increase over June 2020 and a 0.2 per cent increase compared to May 2021.
Download the full report.
July typical seasonal patterns brought less listings to the market and price growth leveled off in most areas and home types.
There were 4,377 detached, attached and apartment homes newly listed for sale on the Multiple Listing Service® (MLS®) in Metro Vancouver in July 2021. This represents a 26.4 per cent decrease compared to the 5,948 homes listed in July 2020 and a 25.2 per cent decrease compared to June 2021 when 5,849 homes were listed.
July’s new listings were 12.3 per cent below the 10-year average for the month.
The MLS® Home Price Index composite benchmark price for all residential properties in Metro Vancouver in July was $1,175,500. This represents a 13.8 per cent increase over July 2020 and is unchanged from June 2021.
Download the full report.
Currently inventory is right around 10,000 listings. This is what we normally see in the quiet winter months of December and January.
Canadians are flush with cash, interest rates are at an all time low and CMHC has relaxed their lending guidelines. Once buyers come back to focusing on their home searches, and Realtors wrap up any summer holidays they have been taking, we expect sales activity to return higher than normal levels.A report from FINTRAC (Financial Transactions and Reports Analysis Center) in the spring declared that $43.5 Billion was transferred from Hong Kong to Canada in 2020. This doesn’t take into account crypto currencies or transfers under $10,000.
Some 300,000 families hold Canadian passports and will be looking to return home.
First quarter data from Statistics Canada showed that the country’s population grew by 82,000, a rate that RBC Senior Economist Andrew Agopsowicz said was “the fastest quarterly increase since the beginning of the pandemic.”
Canada aims to welcome 401,000 new permanent residents in 2021, 411,000 in 2022, and 421,000 in 2023.
It’s difficult to predict when immigration will start to impact the market, but with the rapid growth in population we are expecting a busy fall, and long term vision predicts that the spring market next year will continue to be robust.
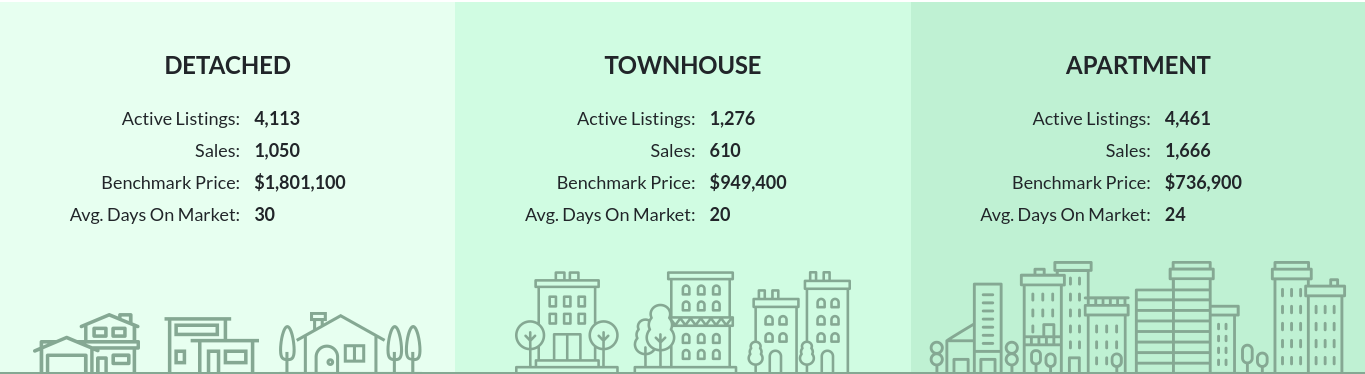
The big dilemma now is that inventory is sitting at an all time low. Aside from the lack of listings, there are only 1,149 new townhouses under construction in all of Greater Vancouver. In the City of Vancouver just 58 new townhouses have started this year. The townhouse shortage is acute in many markets where sales outstripped supply in July, including South Delta, Maple Ridge, Port Coquitlam, Port Moody and Whistler-Pemberton. In Port Moody, for instance, there were only 17 new listings for townhouses but 47 sales in the month, exhausting the total inventory of active listings. Many other markets, such as Coquitlam where July townhouse sales accounted for 95% of listings, are close to near-zero inventory.
Many developers had taken a step back during Covid and are now starting to become active again, however, if they purchase something today they won’t be able to do much for the next 4-5 years due to the slow and arduous permitting process.
As we approach the traditionally high sales seen in September, the shortage of homes for sale, particularly in the strata sector, will be the headline news. Active listings have been falling month-over-month since May.
Canadians are flush with cash, interest rates are at an all time low and CMHC has relaxed their lending guidelines. Once buyers come back to focusing on their home searches, and Realtors wrap up any summer holidays they have been taking, we expect sales activity to return higher than normal levels.
* Areas covered by the Real Estate Board of Greater Vancouver include: Burnaby, Coquitlam, Maple Ridge, New Westminster, North Vancouver, Pitt Meadows, Port Coquitlam, Port Moody, Richmond, South Delta, Squamish, Sunshine Coast, Vancouver, West Vancouver, and Whistler.
